Fat mass and the fat mass index FMI
Authors: Eva Heinen, graduate sports scientist (Univ), Prof. Dr. med. Edgar Heinen
- Fat mass and body size
- Fat mass index
- Definition of target values
- Definition of obesity grades according to the FMI
- Frequency of misclassification of obesity by BMI
- Tables: Body size of women and men: target values and obesity grades according to fat mass
- Example: Man and woman, 1.70 tall, weighing 70 kg Body composition
As described in the body composition chapter and described in detail in the chapters on DEXA and BIA, reliable methods exist today that can be used to determine a person’s fat mass quite reliably. However, as with body weight, the problem with the results is that fat mass increases with body size.
The fat mass index
As shown in my thesis , there is a positive correlation (p<0.05) between body size and fat mass in both women and men. Women have slightly more than 10 kg more fat mass than men of the same height.
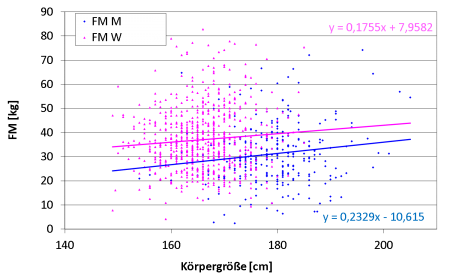
If the fat mass index is calculated by dividing the fat mass by the body height² (in m²) in the same way as the BMI, there is no longer a correlation with body height in men (see Fig. 2). For women, on the other hand, there is a significant but negative correlation – similar to the BMI. For example, 10 cm less height is associated with an increase in FMI of around 10 kg/m².https://profheinen.de/koerperzusammensetzung__trashed-2__trashed/

If one considers that taller women primarily have longer legs and a greater distance between the ribcage and the pelvic bowl, and possibly a longer base between the chin and the base of the breasts, but that the breasts and buttocks, which are naturally endowed with an additional – usually perceived as beautiful – fat deposit in women, do not experience a corresponding “stretching”, the phenomenon described seems easy to explain.
Procedure for defining target values and degrees of obesity
In order to be able to work with the FMI, it is necessary to use it to define normal or, better, target values and degrees of obesity. Under no circumstances can the definition be based on descriptive statistics, as 95% of the population would be considered normal in the 2 S range. Even assuming a 1 S range, only 16.6% of the population would be obese, but an additional 16.6% would be considered lean. As the fat content of the population increases, the standard value would have to become higher. If a significant proportion of the population is considered obese, the definition of normal values cannot be based on a mean value plus deviations, as is usually the case with laboratory procedures, for example. Thus, all common definitions of normal weight use ideal norms, which are difficult to define and have always triggered and will always trigger heated discussions.
The BMI, the use of which is also subject to the problems described above, is generally used today to assess body weight and categorize degrees of obesity. It has proven to be valuable in countless scientific studies, although it must and is clear that the BMI has clear inaccuracies; that it classifies people with very strong muscles as overweight or even obese, while people with little muscle but too much fatty tissue are classified as normal in terms of obesity.
That is why we looked for a method in which the vast experience in dealing with the BMI can be used, but the imprecision of this parameter can be avoided by using the FMI.
As shown in Fig. 3 for women and Fig. 4 for men, there is a very close correlation between BMI and FMI. If the BMI limits are inserted into the regression equation, the lower target value for women is 5.7 kg fat mass/m² and the upper target value is 10.1 kg fat mass/m². Women whose FMI is above the rectangle that forms have a fat mass that is too high for their BMI, while those below the rectangle have less fat mass than could be assumed based on their BMI. The same procedure was used for the various degrees of obesity for men; Fig. 4.


Compilation of obesity grades according to the FMI
Table 1 shows the target values for FMI and the threshold values for the corresponding degrees of obesity for men and women.

Frequency of misjudgement when using the BMI
If one filters out the women and men with a normal BMI of 18.5 to 25 kg/m² from the collective of Eva Heinen’s thesis, 3 – 4 % of those selected have a fat content that is below the norm; 14 % of the women and even 35 % of the men examined – each with a BMI of 18.5 to 25 kg/m² – were to be regarded as obese! This finding raises fears that some scientific studies on obesity could lead to different conclusions than those currently assumed if the fat mass index were taken as the measure of obesity and not the BMI!

The FMI makes it easy to determine the “target range of fat mass” for a particular person, knowing their height. For a woman of 1.70 m height, the target range for fat mass is between 5.7 * 1.7 * 1.7 = 16.5 and 29.2 kg. For a man of the same height, the fat mass may only be between 6.1 and 17.6 kg, i.e. a good 10 kg less, so that a normal fat mass can be assumed for him.
Don’t feel like doing the math?
Then take the standard values and the classification of obesity grades according to the determined fat mass for women or men depending on their size from the following table:
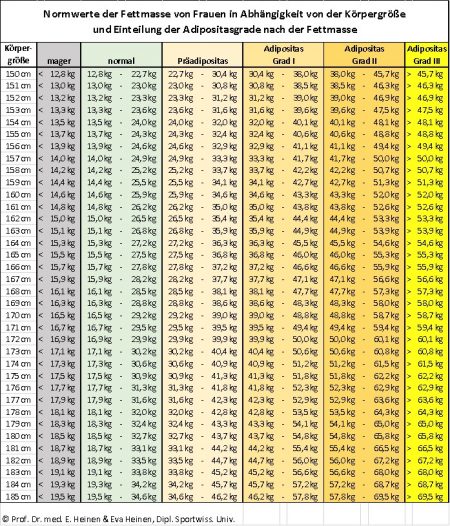
Download for the size-dependent classification of obesity grades according to fat mass for women

Download for the size-dependent classification of the obesity grade according to fat mass for men as a PDF Please also visit our download page!
It is important to point out that when determining fat mass using methods other than the one used here, the determination should be questioned, or at least the FMI should be normalized by correlation with the BMI using the method specified here.
Comparison of female and male fat mass
Using the available data, it is easy to calculate the fat mass of a 1.70 m tall, 70 kg person, i.e. with a BMI of 24.2 kg/m² – different for women and men – (see Table 1), assuming that their FMI lies exactly on the regression line between BMI and FMI.


Fig. 5: Visualization of the data from Table 2: Body composition of a 1.70 m tall, 70 kg person (man or woman) whose fat mass index lies on the regression line between BMI and FMI. See text for details. For this purpose, the BMI is inserted into the formula for the regression line between BMI and FMI, i.e. for the woman
FMI = 0.683 * 24.2 – 6.933 = 9.6 kg/m² (see Fig. 3). This results in a fat mass of 9.6 * 1.7*1.7= 27.7 kg.
Analog for the man:
FMI = 0.629 * 24.2 – 9.558 = 5.7 kg/m² (see Fig. 4). This results in a fat mass of 5.7 * 1.7 * 1.7 = 16.4 kg.
This means that a woman with a height of 1.70 m and a weight of 70 kg – i.e. within the normal range of the BMI – has more than 10 kg more fat mass than a man with the same body measurements! It is clear that the fat-free mass of a man must be higher than that of a woman by the same amount.
In summary, the FMI is a parameter with which the fat mass of a person can be made independent of size and is therefore ideally suited for classifying the degree of obesity using experience with the BMI!