Fat burning does not stop during intensive physical exertion
According to a publication: Lotz, Heinen, Stöcker, Beyer, Heinen; 2019
Anyone who talks about the optimum fat-burning pulse has not been paying attention to biochemistry!
The ratio of exhaledCO2 and inhaled O2 (the respiratory quotient) can be used in spiroergometry to determine how much glucose or fatty acids contribute to energy production, at least at rest. ( seeIndirect calorimetry )
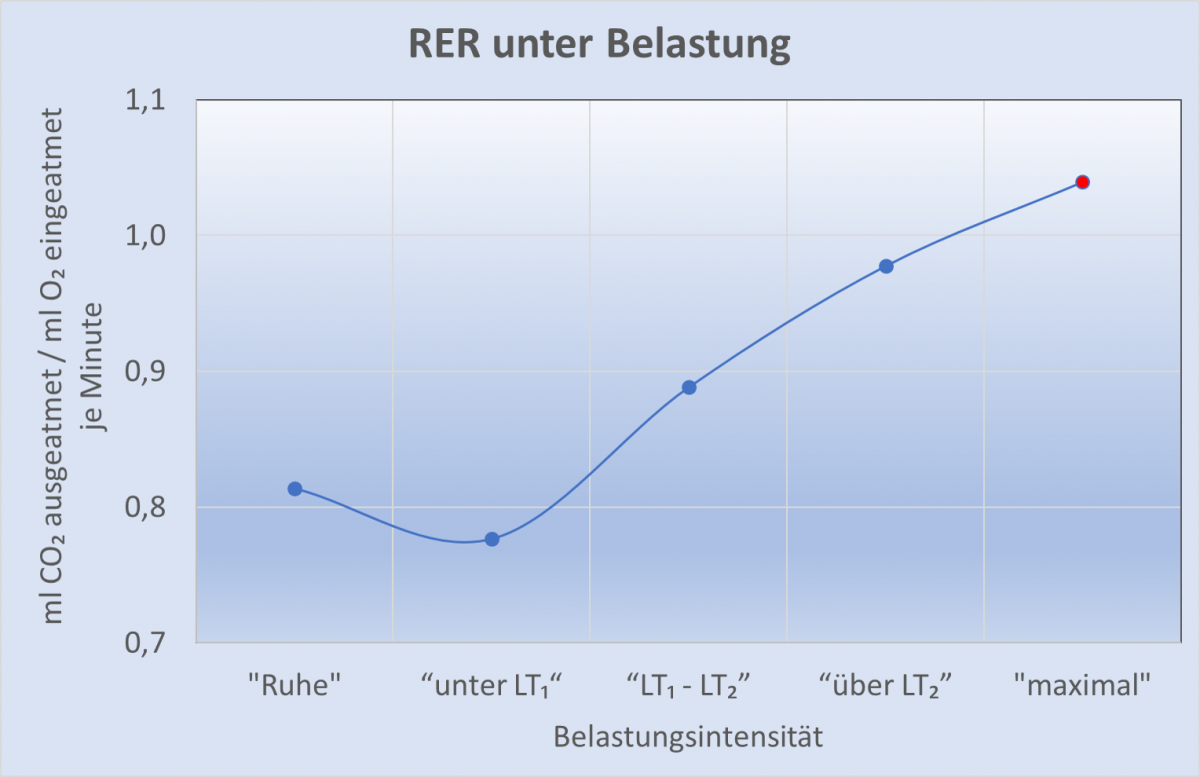
A typical example of the course of the respiratory quotient (more correctly: the expiratory exchange rate; RER) under a gradual load (increase in load by 40 watts every 4 minutes) until exhaustion is shown in Fig. 1.
As shown in the chapter on indirect calorimetry, the calorie consumption can be calculated from the oxygen consumption using the so-called caloric equivalent of an average of 4.85 Kcal / l of oxygen consumed. The caloric equivalent changes slightly depending on the RER, i.e. whether more glucose or fatty acids are used to provide energy. The corresponding formula can be found here. In the following data, the caloric equivalent is adjusted to the corresponding RER.
Table 1 shows how many calories the 8 footballers consumed on average during the increasing load and how many of the calories are produced from the oxidation of fatty acids or glucose, assuming that all of theCO2 in the exhaled air comes from the combustion process. See Table 2 for the respective VCO2 and VO2 values.

Fig. 2 shows the proportion of fat oxidation and glucose oxidation under the above assumptions for the different exercise levels of our test group.
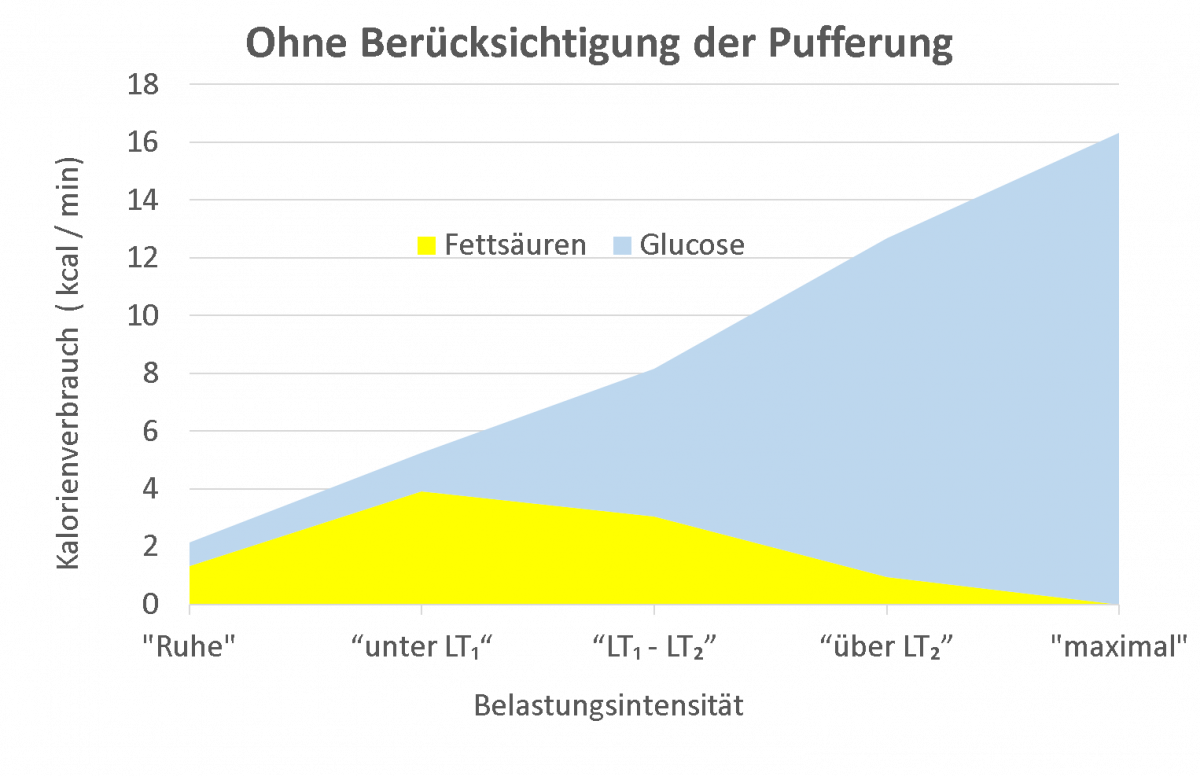
At this point you can see a typical picture that has led to the statement that during intensive physical exertion, not only in percentage terms, but also in absolute terms, fewer and fewer fatty acids contribute to energy production, and that at maximum exertion only glucose is oxidized. At the same time, the glucose should be broken down into lactate with an extremely low degree of efficiency. Which unconvincing engineer has come up with something like this?
No, not badly constructed,
incorrectly described!
One of the protagonists who made a huge contribution to spiroergometry, Wasserman, pointed out in his work in 1964 that the RER should only be used as a measure of the proportion of fatty acids and glucose in oxidation if no other source of exhaledCO2 was available.
However, Wasserman et al. showed in 1973 that bicarbonate decreases with the increase in lactate in the blood with increasing exercise – a finding that we also recorded in our footballers, but which can also be seen in every spiroergometry test in which a blood gas analysis is carried out at the same time. As an example, we show the data from our examination of the 8 soccer players in Fig. 3:

Unfortunately, Wasserman and the many other researchers who have made the same claim have failed to calculate how large the proportion of exhaledCO2 is due to the buffering of lactate. As a result, the theory that the amount ofCO2 in the exhaled air resulting from the drop in bicarbonate is negligible has prevailed. The aim of our study was to investigate how many mlCO2/minute result from the buffering of lactate by bicarbonate at higher loads.
Calculation of the proportion of buffering in the exhalation ofCO2 at higher physical exertion.
(This task should be easily solvable by a student in the advanced chemistry course!)
- Question 1: What does bicarbonate have to do withCO2?
- Answer: IfCO2 is introduced into water, carbonic acid is formed, which splits into bicarbonate and H+ ions; a reversible process that is in equilibrium in every reaction step.

The path ofCO2 in the organism.CO2 is produced in the cell during oxidation. This enters the blood. There it combines with water to form carbonic acid. At a physiological pH of 7.4, 95% of the carbonic acid decomposes into bicarbonate and hydrogen ions. When the blood reaches the lungs,CO2 is exhaled and replenished via carbonic acid from bicarbonate in a process that is extremely accelerated by enzymes, catalysts. Under normal conditions, as muchCO2 is exhaled as is produced. There is an equilibrium.
- Answer: IfCO2 is introduced into water, carbonic acid is formed, which splits into bicarbonate and H+ ions; a reversible process that is in equilibrium in every reaction step.
- Question 2: In spiroergometry, the amount ofCO2 exhaled is given in mlCO2, while the concentration of bicarbonate is given in mmol/l. How is the conversion done?
- Answer: According to the thermal equation of state, the volume of gases at a body temperature of 37°C is 25.4 l – mol -1.
- Question 3: How muchCO2 is dissolved in the blood?
- Answer:CO2 physically dissolved at 37 °C[ mmol – l-1] ] = PaCO2 [mm Hg] – 0.0304 [mmol – l-1 – mmHg-1] (molar solubility coefficient; Löffler & Petrides, 1988)
- Question 4: How much bicarbonate (HCO3–) is present in the blood?
- Answer: at a pH value of 7.4, 95.3% of theCO2 dissolved in the blood is present as HCO3-, only 4.7% as carbonic acid. If the pH value falls, the proportion of HCO3- in the CO2 dissolved in the blood also falls.
- Question 5: How can you calculate the total amount ofCO2 present in 1 liter of plasma?
- One liter of serum at aCO2 partial pressureof 40 mm Hg thus contains
25.4 ml – mmol -1 – 40 mm Hg – 0.0304 [mmol – l-1 – mmHg-1] i.e. 31 mlCO2 physically dissolved. In addition, the serum (at a pH of 7.4) contains an average of 24 mmol bicarbonate – l-1, which corresponds to a further 610 mlCO2 in 1 l serum (i.e. a total of 641 mlCO2 / l plasma).
- One liter of serum at aCO2 partial pressureof 40 mm Hg thus contains
- Question 6: How large is the distribution space of bicarbonate in the organism?
- Answer: In 2001, Roecker et al determined a distribution volume for bicarbonate of 25 % of body weight. This value is in close agreement with the extracellular space determined by Levitt, 2003, which was also approx. 25 % of body weight.
- Question 7: How muchCO2 is dissolved in the body or is present as bicarbonate?
- Answer:CO2 total / l plasma x body weight /4
- Question 8: How many ml of the exhaledCO2 / minute come from the buffering?
- Answer: e.g. at maximum load:
Total CO2 at the end of the load level “above LT2” –Total CO2 at the end of the load level “Maximum” / 4 (stage duration 4 minutes).The results of our investigations:
Table 2 shows the essential data from our study, calculated and compiled as described above. The intensity of the graded exercise was indicated according to the lactate threshold concept as: “Rest”, exercise below lactate threshold 1 (LT1), between lactate thresholds 1 and 2 (LT1 and LT2), above lactate threshold 2 (LT2) and “maximal”. The mean VO2max of the subjects was 42.3 ± 1.9 ml O2 ·kg-1 ·min-1 (X̅ ± SX̅ ) is measured. The second line of the table shows the oxygen consumption achieved in the respective exercise level as a % of VO2max.
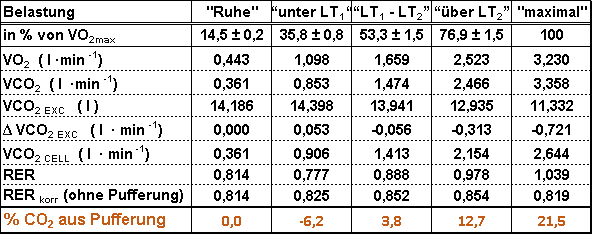 Table 2: Oxygen consumption at the respective exercise levels in % of VO2max, (X̅ ± S X̅ for n = 8 subjects). Mean values of VO2 and VCO2 per minute. Mean value of VCO2EXC at the end of the respective exercise. Δ VCO2EXC = (VCO2EXC “Exercise” – VCO2EXC “Rest” ). VCO2CELL = VCO2 + Δ VCO2EXC for the respective load. The RER was calculated from VCO2/ VO2, the RERcorr from VCO2CELL / VO2. The last line shows the percentage of exhaledCO2 that is buffered. *VCO2EXC = lCO2 in the extracellular space; **VCO2CELL = lCO2 produced per minute during cellular respiration.
Lines 3 and 4 indicate how much O2 was inhaled and how muchCO2 was exhaled per minute. The respiratory exchange rate (RER) was determined by dividing VCO2 / VO2.
The parameter VCO2EXT indicates how much CO2 is present in the form of physically dissolved CO2 or in the form of bicarbonate (HCO3–) in the distribution space of bicarbonate (likely identical to the extracellular space). The increase in this value “below LT1” shows that CO2 was retained in the body during this phase, which can be explained by hyperventilation due to the unfamiliar environment and breathing through a mask at the beginning of the examination, a very common occurrence.)
As the lactate increases, less and lessCO2 can be measured in the extracellular space due to a drop in the pH value and PaCO2, the arterialCO2 partial pressure, and thus also the bicarbonate. TheCO2 released from the extracellular space is exhaled via the lungs and thus comes from the buffering of lactate and not from the oxidation of substrates at the cellular level!
In the study cited, the amount ofCO2 in the exhaled air resulting from the buffering of lactate was determined for each exercise level. At maximum exercise, 21.5% of the exhaledCO2 in our group came from buffering (see bottom line). This volume ofCO2 must not be used to calculate the RER!
If the RER is calculated correctly, the values shown in the penultimate line result. The striking difference in the course of the RER and the corrected RERcorr can be seen in Fig. 4.
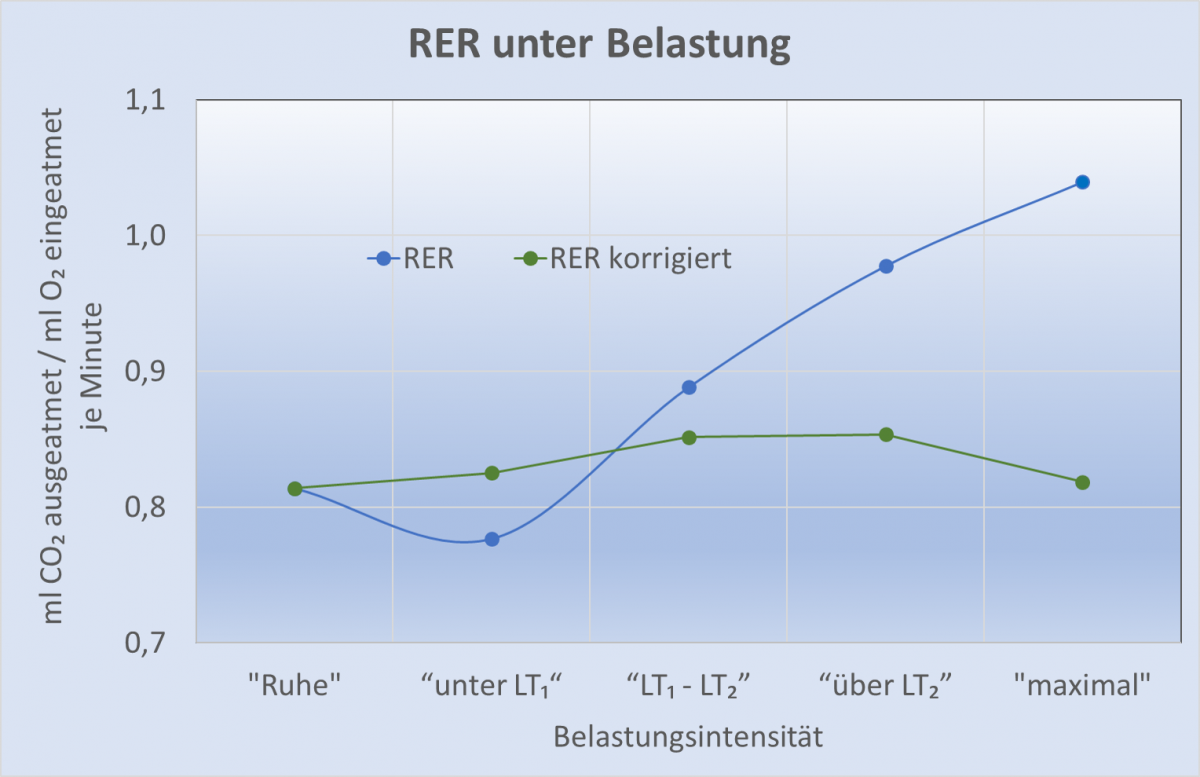
Fig. 4: Progression of the RER and the RERcorr corrected for the proportion of buffering inCO2 exhalation during the course of exercise[/caption
- Answer: e.g. at maximum load:
 Table 3: Calculation of calories from the oxidation of fatty acids and glucose during a graded exercise test in 8 soccer players using the corrected RER (respiratory exchange rate).
If the VCO2 and RERcorr data corrected for the effect of buffering are used in indirect calorimetry, the actual proportions of fat and glucose oxidation for the various exercise levels in our test subjects are shown in Table 3 and visualized in Fig. 5.
 Fig. 5: Actual calorie consumption from the oxidation of fatty acids (yellow) and glucose (blue) in the course of gradual exercise up to maximum performance after correction ofCO2 exhalation as a result of lactate buffering.(According to Lotz et al, 2019)
 The data clearly shows that even at the highest levels of physical exertion – even during the various increases in exertion in spiroergometry – fat burning does not stop, but contributes to a considerable extent to the supply of energy.
Quintessence:
With the knowledge of a student in an advanced chemistry course, errors in medical and sports science textbooks can be made visible. It is to be hoped that the manufacturers of spiroergometry devices, software developers and, in particular, authors on the Internet who write on the subject will also take the trouble to understand the correlations presented here and make appropriate corrections.
We also consider it important to point out that distortions due to lactate buffering only occur when the lactate concentration changes! If lactate remains constant, for example, during a continuous run over several minutes at 3 – 4 mmol/l, then the RER can again be used to assess energy provision from glucose or fatty acids. In this case, there is no change in CO2 or HCO3– concentration in the blood, and the exhaled CO2 comes from the cells!
Many people have long pointed out that physical activity – especially when it comes to losing weight – is all about total calorie consumption. Perfectly ok! Now you have another argument against the fat-burning heart rate myth!
You should also bear in mind that training that does not lead to a (not too strong!) increase in lactate is very ineffective in terms of increasing physical performance and therefore health.
However, this does not mean aiming for a maximum lactate increase; that is also not sensible from a health point of view! (see lactate threshold concept)