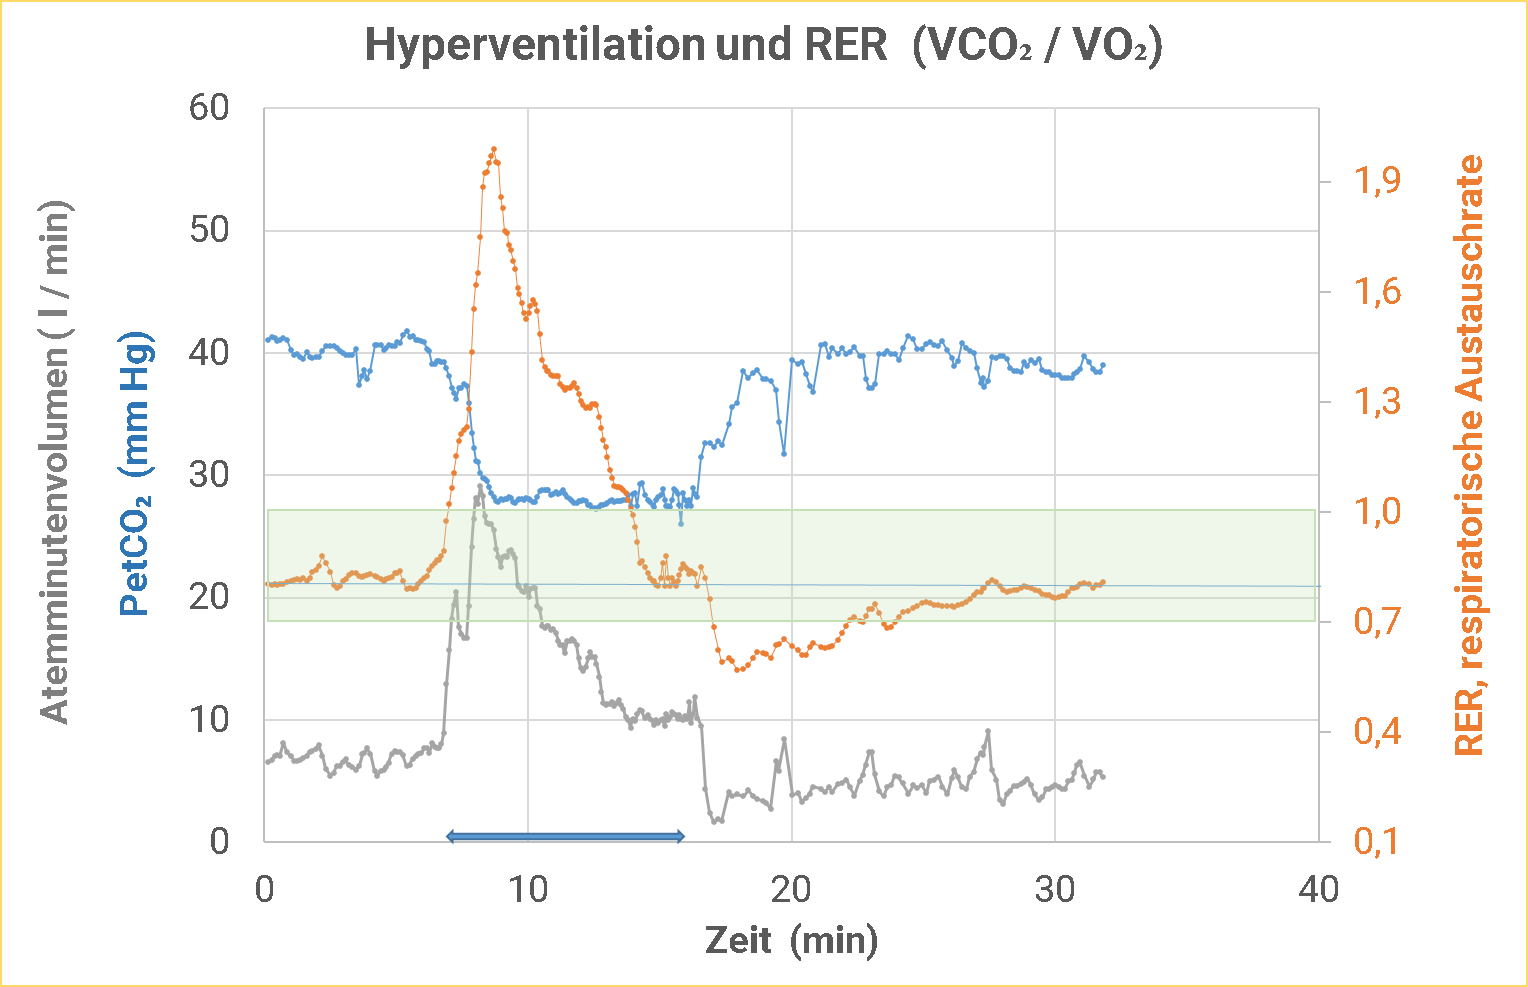
In the self-experiment shown above, hyperventilation is demonstrated by the PetCO2 achieved, the CO2 partial pressure at the end of the exhalation phase. Under normal conditions, this is between 35 and 45 mm Hg. At the beginning of the experiment, the PetCO2 was just above 40 mm Hg. The respiratory minute volume at 7.5 l. Under these “resting” conditions, a RER of around 0.8 was measured.
After 7 minutes, respiratory minute volume was rapidly increased until a PetCO2 of < 30 mm Hg was achieved. For orientation, PetCO2 was made constantly visible to the subject on the spirometer. After the initial massive hyperventilation required to achieve a low PetCO2, the respiratory minute volume could be successively reduced while maintaining the PetCO2 below 30 mm Hg. After about 7 minutes, a steady state was reached with a respiratory minute volume of just over 10 l.
The RER increased to values up to 2 within a very short time after the onset of hyperventilation! Biochemically, there is no metabolic process in which such a result could occur as a consequence of energy supply! Values just above 1 can be reached at most with the stuffing goose, if it makes fats out of the massively added carbohydrates! The additional exhalation of CO2 triggered by hyperventilation changes the rer without a deviation of the ratio of the burned substrates fatty acid to glucose.
From various spiroergometry equipment manufacturers, the ratio of glucose to fatty acids used to provide energy is calculated breath by breath. A brief deeper breath by the subject significantly increases the exhalation of CO2 more than the uptake of O2. The RER rises immediately. This has nothing to do with a different ratio of energy supply at the cellular level. The procedure to indicate from breath to breath significantly changing ratios of fats to glucose in the energy supply is completely absurd and should be removed from the software as soon as possible!
However, in the further course of hyperventilation, the RER decreased again and reached the initial value again after about 7 minutes in the steady state of hyperventilation! From this point on, no additional CO2 was released into the breathing air due to hyperventilation! During this time period, the RER should again represent an indication of the glucose to fat ratio in energy supply.
After a total duration of 10 minutes, hyperventilation was briskly terminated by conscious hypoventilation, as indicated by the increasing PetCO2 values and the very low minute respiratory volume. Already after about 6 – 7 minutes normal PetCO2 values were reached again.
The RER dropped sharply to 0.57, a value that can only be explained by a retention of CO2 in the organism. By the end of the experiment, the RER then increased back to baseline.
Quintessence:
- At the onset of hyperventilation, the RER increases massively.
- In the steady state, hyperventilation has no measurable effect on the RER, which then again allows a conclusion to be drawn about the ratio of glucose to fatty acids for energy supply.
- When hyperventilation subsides or ceases, the RER decreases substantially, even to values below metabolic possibilities.
- Interpreting the ratio of VCO2/VO2 breath by breath does not make sense; a short sigh would be incorrectly interpreted as an increase in the ratio of glucose to fatty acids for energy supply.
PS:
The subject did not feel well during hyperventilation: he had slight dizziness, tingling around the mouth, ice-cold hands: typical symptoms of hyperventilation. s also Eva’s film on you tube: Stress, stress hormones and hyperventilation.