Authors: Eva Heinen, graduate sports scientist (Univ), Prof. Dr. med. Edgar Heinen
Body composition can be viewed from different angles. For example, there are studies that allow a statement to be made on the composition of the body according to the chemical elements, i.e. chemically defined substances (molecular level), the cellular level or also according to different, anatomically definable tissues.
- Why should the body composition be measured?
- Using the BMI bodyweight of people of different heights can be compared.
- BMI to assess the degree of obesity
- Body size-adapted target values and classification of obesity levels according to fat mass
- Body composition and weight loss
- Has the fat tissue decreased or the muscles?
- Targert value of the fat mass index (FMI)
- Comparison of female and male fat mass
- Muscle mass index (MMI)
- Comparison of female and male body composition
- Clinical example
The most important motivation to address body composition is obesity.
The WHO, the World Health Organization, defines obesity as “an abnormal or excessive accumulation of fat that can lead to adverse health effects”.
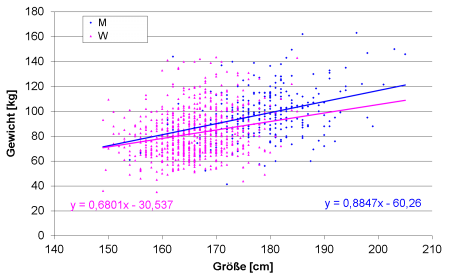
Of course, today nobody uses body weight as the only parameter for assessing whether someone is obese or not. The fact that height has a very significant influence on body weight is quite clear and can be seen in Figure 1.
There have been many attempts to find a parameter that can eliminate the influence of body size on the assessment of whether obesity is present or not. The so-called body mass index (BMI), which is determined as follows, has become established:
BMI = weight (kg) / height² (m²)(what is the mathematics behind this? an attempt at an explanation)

As Figure 2 shows, there is no longer a significant correlation between BMI and height in men. However, shorter women have a lower but significantly higher BMI than taller women. For example, the BMI of women 10 cm shorter increases slightly but significantly by 1.2 kg/m². You can find our explanation of this phenomenon in the FMI chapter.
The WHO defines overweight (preadiposity) as a BMI (body mass index) of > 25 kg/m². Obesity is present when the BMI > 30 kg/m² is determined.
However, the BMI is by no means the appropriate parameter for assessing whether a person is obese or not. A high body weight can certainly be the result of strongly developed muscles. Those affected may then have a BMI of > 25 , but by no means too much fatty tissue. Not only bodybuilders fall into this group, but also very muscular athletes are often classified as obese when using the BMI! (for the frequency of misjudging the degree of obesity with the BMI, see link) Conversely, there are a significant number of people who have a normal BMI but visibly have too much fatty tissue.

Since dual photon absorptiometry(DEXA) is now a very reliable method for determining fat mass at the molecular level, and bioelectrical impedance analysis(BIA), which is usually derived from it, is a less precise but, if used correctly, easily reproducible and less complex method for determining fat mass, it is no longer acceptable in our view to use body weight rather than fat mass to determine obesity and its degree!
To define obesity, it is absolutely essential to measure a person’s fat mass.
Various methods are available for this purpose:
- Underwater weighing
- Dual-photon absorptiometry, also known as DEXA
- Bioelectrical impulse analysis (BIA)
- more
DEXA, which is considered the gold standard today, and BIA will be discussed in separate chapters.
What these methods have in common is that they can be used to measure or calculate the body’s fat mass. As described in the chapters
As shown above, fat mass, fat-free mass and muscle mass are also clearly dependent on body size. The chapters mentioned above show how the corresponding standard values or target values can be defined for each body size using the huge amount of data available for the BMI.
As we assume that by no means everyone wants to work their way through the sometimes complex interrelationships, we are providing you with the target values for the fat mass of women and men and the classification into degrees of obesity depending on body size in advance – as a kind of summary – as a download at .
Size-dependent classification of obesity levels according to fat mass for women
Size-dependent classification of the degree of obesity according to fat mass for men
Body composition and weight loss
Changes in body weight result almost entirely from a change in either the fatty tissue or the muscles – at least if the problem of edema, i.e. water retention in the tissue, is disregarded. A significant change in the weight of the internal organs, bones and skin is only found in their fat mass, which, however, is part of the total fat mass when determining the fat mass using DEXA or BIA.
The aim of all attempts to lose weight is to have less fatty tissue afterwards than before. Everyone is increasingly realizing that losing muscle is counterproductive, as it reduces the basal metabolic rate and is the main cause of the yo-yo effect.
In her diploma thesis in the sports science degree program at the Technical University of Munich, Eva Heinen published studies, interpretations and target values for various parameters that are of crucial importance for understanding the changes in body composition during weight loss.
Download: Diploma thesis Eva Heinen
In the study, she analyzed data from the measurement of body composition using the DEXA method from 1006 people (709 women and 297 men) at the Endocrinology Practice in Nuremberg.
Change in fat mass or muscle mass?
Fat mass
Using the DEXA method, the thesis was able to show that not only body weight, but also fat mass (FM) and fat-free mass (FFM) correlate with body size. As with body weight, the influence of height on FM and FFM can be virtually eliminated by forming the corresponding indices: BMI, fat mass index (FMI) and fat-free mass index (FFMI) by dividing by the square of height in meters. This produces parameters that are independent of body size, which can also be processed in a statistically reasonable way, whose target / standard values can be defined and should be integrated into the assessment of body composition.
For the procedure for defining target values for FMI and the classification of obesity levels according to FMI, see here.

Table 1: Classification of obesity levels according to the fat mass index (FMI) for men and women. Normal adipose tissue was assumed if the determined FMI was measured in the range for “normal”.According to these results, the differences between men and women can be illustrated using a male or female person of 1.70 m height and 70 kg body weight: For the procedure see. Link

Tab. 2: Body composition of a 1.70 m tall, 70 kg person (man or woman) for whom the fat mass index was read from the regression line between BMI and FMI for a BMI of 24.2 kg/m². For details see chapter FMI. The rather large differences in body composition according to fat mass and fat-free mass become clearer in the following figure:

Muscle mass
In many publications, muscle mass is equated with the fat-free mass of the body. Internal organs, skin, bones, brain and also the fact that adipose tissue consists not only of fat mass, but also on average around 22% of fat-free tissue, are simply neglected. The effects of this are described in Fig. 6. But first things first:
The FFM is made up of the muscle mass, the fat-free mass of the adipose tissue and the mass of all other organs.
It is relatively simple, but particularly important, to take into account the FFM of the fatty tissue: 1 kg of fat then represents an additional 0.28 kg of fat-free mass of the fatty tissue.
There is a lot of data in the literature that shows a dependence on body size for most organ weights. According to this, a 70 kg person of 1.7 m height (whether male or female) consists of around 22 kg in addition to muscle and fatty tissue: skin, bonesand internal organs. This can be used to calculate an index (HKIO index) of 7.6 kg/m².
The muscle mass index can then simply be calculated as the difference between:
MMI = BMI – FMI x 1.282 – 7.6 kg/m² (HKIO index)
All indices can be converted to the actual weight of a person by multiplying the index by the square of the height (in meters).
If we compare the woman and man shown in Fig. 3, taking into account the additional parameters (fat-free mass of the adipose tissue and the factor for skin, bones and internal organs), the following body composition results:

The data is visualized in Fig. 4:

Fig. 4 clearly shows how much women and men differ in terms of body fat mass and muscle mass with an identical BMI. The details are shown in the corresponding chapters.
The following standard values for the muscle mass of men and women were derived in the MMI chapter:
Women: 5.0 ± 1.9 kg/m²
Men: 10.6 ± 2.2 kg/m²
The mean values ± 1 standard deviation are given.
Clinical example
The following clinical example illustrates why this effort should be made:
An 18-year-old man presents to an endocrinologist because of massive obesity and an undersized limb. The data:
Height 1.87 m, weight 116 kg, massive subcutaneous fatty tissue. The penis and testicles were difficult to find (too small at 2 – 3 ml), the penis was almost completely hidden in at least 10 cm of fatty tissue in front of the pubic bone. Freed from school sports, he did not dare to shower in the presence of others. No other abnormalities apart from a slightly too low testosterone level for his age.
Perhaps the information about the problems of obesity in relation to health in general motivated him to lose weight, but certainly the endocrinologist’s statement that sexual development would normalize if he lost a lot of weight. Squeezing the fatty tissue in front of the pubic bone already brought a few centimeters of member out of hiding!

Figure 6 shows the progression: Diet counseling and gym membership (3 – 4 visits per week) led to a massive weight loss of 45.5 kg in 2.5 years. If we had restricted ourselves to looking at FFM as a measure of muscle mass (everything that is not yellow), we would have told the young man, who after 2.5 years is now really muscular, that his muscle mass had hardly changed at all. Clinically, this is certainly completely wrong.
Less fat mass had led to a drastic reduction in the fat-free mass of the adipose tissue by 13.4 kg. Muscle mass had more than doubled from 10.9 to 26.6 kg!
Incidentally, the communal shower after sport was no longer a problem thanks to the properly developed secondary sexual characteristics!
Measuring body composition helps if you interpret it correctly!